
A CIO at a regional insurer walks into the investment committee with a forty-slide deck. The architecture diagrams are excellent. There is a heat map of the estate in red, amber and green. Slide 22 says the policy administration platform carries eleven years of technical debt and that modernization will improve developer velocity by roughly 40%. Slide 31 asks for £34 million over four years.
The CFO asks two questions. What is the payback period, and what happens if we do nothing for another eighteen months? The CIO has no clean answer to either, because the deck was never built to answer them. The committee defers. Six months later the same deck returns with better graphics and the same outcome.
Here is the claim: your business case is not failing because it is badly told. It is failing because it is denominated in a currency your capital allocation process cannot convert. Velocity, maintainability and technical debt are worth nothing to a finance function whose job is to compare your request against a distribution centre, a bolt-on acquisition and a share buyback. Those alternatives arrive with run-rate impact, risk-adjusted cash flow and a balance sheet treatment. Yours arrives with a heat map.
The fix is not better storytelling. Storytelling is what people reach for when the arithmetic is missing, and CFOs have a detector for it. The fix is translation. Finance is equipped to evaluate exactly three arguments, and a modernization program can be honestly expressed as all three: cost avoidance against a rising do-nothing baseline, reduction in risk-adjusted expected loss, and the option value of changing your systems faster than you can today.
Build all three, present them separately, and make sure a sceptic can reject one and still fund the program on the other two.
Why “reduce technical debt” is an unfundable phrase
Technical debt is a good metaphor and a terrible budget line. It fails three tests every funded initiative passes.
It has no unit. Debt on a balance sheet has a principal, a rate and a maturity. Technical debt has none of these, so “significant debt” is unfalsifiable, and finance treats unfalsifiable claims as decoration.
It has no counterfactual. A warehouse investment is compared against continuing to lease third-party space at a known and rising rate. “Reduce technical debt” is compared against nothing, so the committee supplies the comparison itself, and the one it supplies is always “spend zero and nothing changes.”
It has no completion state. Nobody believes the debt will ever be paid off, including you. A request with no terminal condition reads as a permanent annuity paid to the technology function, which is what a CFO exists to resist.
Turning 30% into a line item on your own P&L
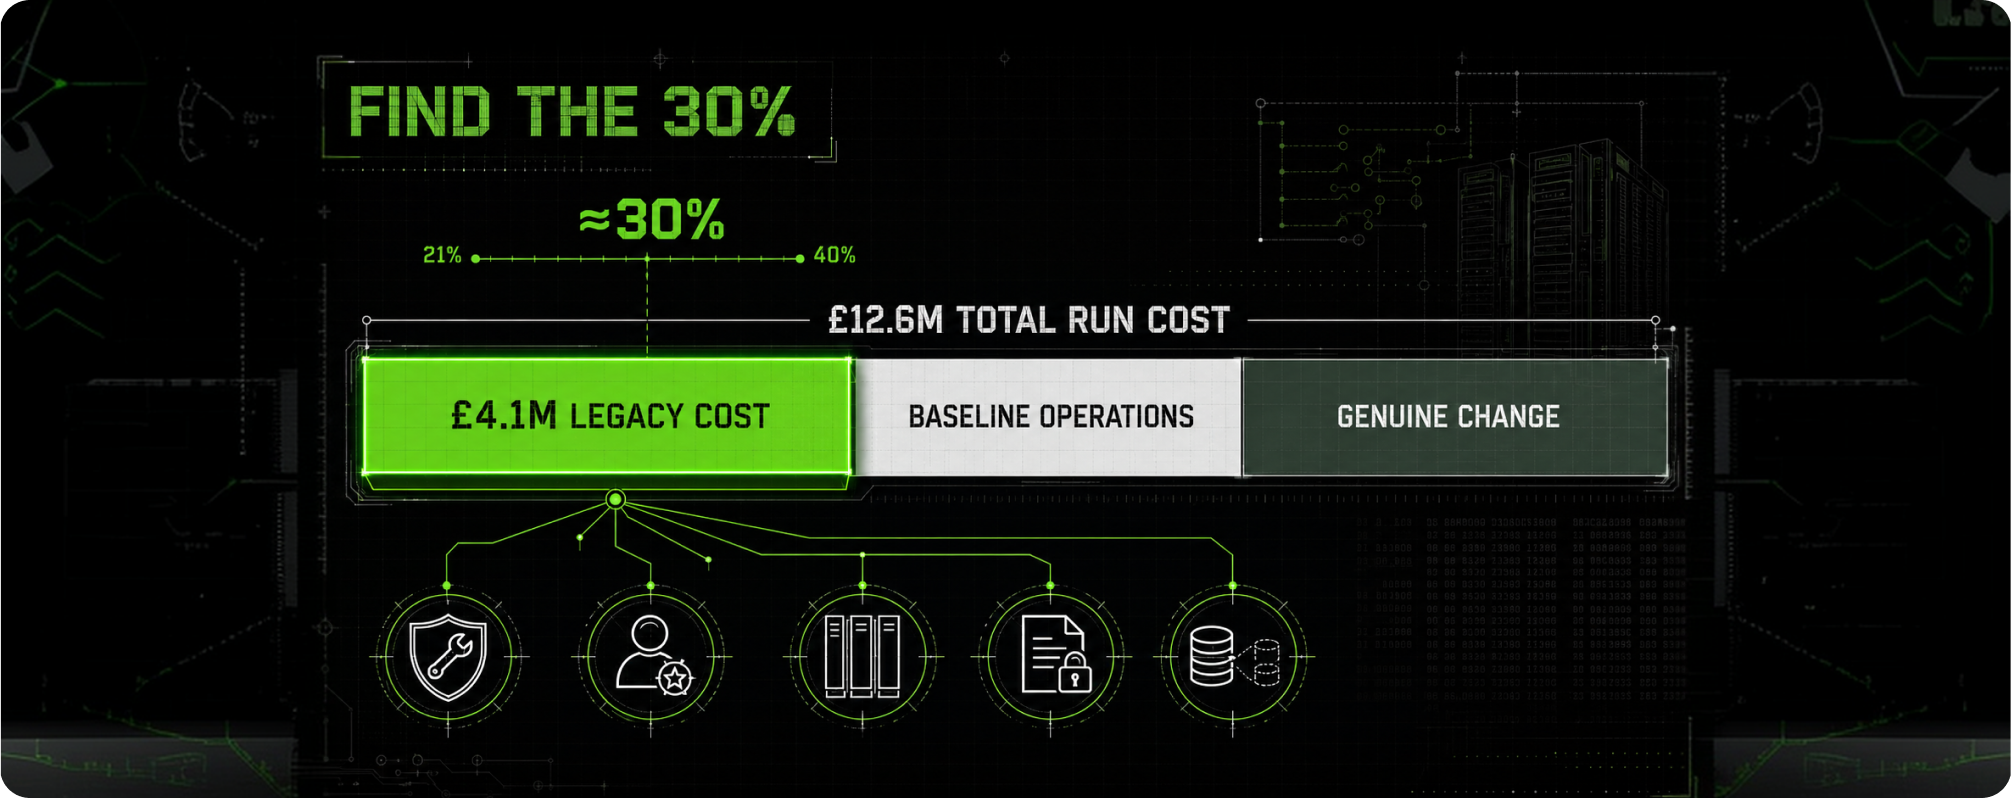
The Deloitte 2026 Global Technology Leadership Study found that technical debt consumes 21% to 40% of IT spending, midpoint around 30%. Quoting that on a slide is a talking point. Reproducing it on your own P&L is an argument.
Take total technology run cost for the last completed fiscal year and allocate every pound to one of three buckets:
- Cost that exists only because of the current implementation. Extended support fees on out-of-support products. The contractor rate premium above market for COBOL, JCL, PowerBuilder or Delphi skills. MIPS consumed by batch jobs a modern query would not need. Duplicate licences carried because two systems cannot be consolidated. The DR site that exists because the primary cannot fail over cleanly.
- Cost that would exist under any implementation. Baseline hosting, identity, network, service desk, the licences you would buy again tomorrow.
- Genuine change spend delivering new business capability.
Compute bucket one as a share of the total. In estates we have triaged it typically lands in the twenties to low thirties: consistent with the published range, derived from your own ledger.
The sentence you want to say is not “Deloitte says technical debt is 30% of IT spend.” It is “We spent £12.6 million running this platform last year, and £4.1 million of that exists only because of decisions taken in 2008.” That has a unit, a counterfactual and, once you commit to a target state, a completion condition.
Argument 1: cost avoidance is a counterfactual, not a saving
The most common error in these cases is presenting cost avoidance as cost reduction. Finance will check, and the check will fail, because run costs rarely fall in absolute terms in the first two years. They rise more slowly than they would have. That is still real money, but it has to be modelled honestly.
Build the current-state run cost stack
Assemble the full annual cost of keeping the system alive, not just the line your budget calls “maintenance.” A composite example, from a mid-sized general insurer we’ll call Ardmore Mutual, running policy administration on z/OS with CICS and DB2 behind a PowerBuilder underwriting front end:
| Current-state annual run cost | £m |
|---|---|
| Hardware lease and MIPS capacity | 3.2 |
| Software licences (z/OS, CICS, DB2, scheduler, security, tooling) | 4.1 |
| Specialist contractors, including rate premium | 2.6 |
| Vendor extended-support fees on out-of-support components | 0.9 |
| Secondary site and DR retention | 0.7 |
| Unplanned incident cost (recovery labour, SLA credits, write-offs) | 1.1 |
| Total | 12.6 |
Two lines are usually missing from the first draft: the contractor rate premium, buried in a professional services accrual, and incident cost, missing because nobody costs incidents. Both are what make the model credible rather than convenient.
The do-nothing curve is not flat
Build the counterfactual with defensible drivers rather than one blended inflation number. For Ardmore: contractor rates rising around 9% annually as the pool shrinks, licence and hardware costs rising 5%, volume growth near 4% driving capacity, and a step change in year three when a major component reaches end of support and the vendor’s extended tier steps up. Blended, that baseline compounds at about 7% a year, plus a £1.8m step in year three that never comes back out.
The workforce driver is the one people underestimate. With roughly 220 billion lines of COBOL in production, an average COBOL programmer age around 55 and roughly 10% of that population retiring each year (DreamFactory), you are not forecasting a rate rise. You are describing a demographic fact.
The seven-year model, with the J-curve shown honestly
| Year | Do-nothing run cost | Modernized run cost | Program spend | Modernized total | Net cash delta | PV at 9% | Cumulative PV |
|---|---|---|---|---|---|---|---|
| 1 | 13.5 | 12.9 | 6.2 | 19.1 | −5.6 | −5.14 | −5.14 |
| 2 | 14.4 | 12.2 | 9.4 | 21.6 | −7.2 | −6.06 | −11.20 |
| 3 | 17.2 | 10.4 | 7.8 | 18.2 | −1.0 | −0.77 | −11.97 |
| 4 | 18.4 | 7.9 | 4.6 | 12.5 | +5.9 | +4.18 | −7.79 |
| 5 | 19.6 | 5.6 | 1.2 | 6.8 | +12.8 | +8.32 | +0.53 |
| 6 | 20.9 | 5.4 | 0.0 | 5.4 | +15.5 | +9.24 | +9.77 |
| 7 | 22.3 | 5.5 | 0.0 | 5.5 | +16.8 | +9.19 | +18.96 |
All figures £m. Discount rate 9%, matching Ardmore’s stated WACC. Program spend £29.2m. Nominal seven-year cash advantage £37.2m; net present value +£19.0m; discounted payback in year five.
Three things matter more than the numbers. Years one and two are worse than doing nothing, and the table says so, because you are running the old platform and building the new one at once. The modernized run cost does not reach zero and ticks up in year seven, because new platforms have costs and they grow. And the discount rate is the company’s, taken from FP&A rather than chosen; picking your own is the fastest way to have the model dismissed.
How to present a J-curve without losing the room
The J-curve is not a problem to hide. It is a problem to pre-empt, because every board member has seen a program go into one and never come out.
Lead with it. Open the finance section with “this costs more than doing nothing for thirty-one months, and here is exactly why,” rather than letting someone find it on slide 40. Name the dual-run period as a discrete, time-boxed, separately budgeted item with a named owner and an end date, because dual-run is the phase that silently becomes permanent.
Then show one sensitivity, not twelve. The most useful is delay. For Ardmore, starting eighteen months later cut seven-year NPV by roughly a third, because the baseline kept compounding and the year-three support cliff arrived before any migration had happened. That chart turns “not now” into a priced decision rather than a free one.
Argument 2: risk-adjusted expected loss is what actually moves boards
Cost avoidance gets you taken seriously. Risk gets you funded. Not because boards are irrational, but because a CFO already runs expected-loss calculations several times a year on insurance retention, counterparty exposure and treasury hedging. Present modernization in that form and you are handing them a familiar spreadsheet rather than asking them to learn a new frame.
Build a quantitative risk register in an afternoon
Five columns. Scenario, annualized probability, loss if it occurs, expected annual loss, and residual expected annual loss after modernization. Anything more sophisticated gets challenged on its assumptions rather than its conclusion.
| Scenario | P(annual) | Loss if occurs (£m) | Expected annual loss ( £m) | Post-modernization EAL ( £m) | Delta |
|---|---|---|---|---|---|
| Unrecoverable outage >72h in a component with no remaining expert | 4% | 18.0 | 0.72 | 0.09 | 0.63 |
| Adverse regulatory finding on operational resilience (DORA) | 12% | 4.5 | 0.54 | 0.08 | 0.46 |
| Breach originating in an unpatchable component | 6% | 5.56 | 0.33 | 0.14 | 0.19 |
| Loss of the last two people who understand the rating engine | 22% | 2.2 | 0.48 | 0.06 | 0.42 |
| Forced emergency upgrade at vendor end-of-support, under duress | 25% | 2.8 | 0.70 | 0.03 | 0.67 |
| Batch overrun causing a late regulatory filing | 15% | 1.2 | 0.18 | 0.02 | 0.16 |
| Total | 2.96 | 0.41 | 2.55 |
Ardmore’s register showed a £2.55m annual reduction in expected loss. Because that phases in only as components migrate, the model credited it from year four onward, worth roughly £6.4m in present value. Crediting it from year one would have added about £6m of NPV and cost the case its credibility.
Loss magnitudes should come from outside your own head. The breach line uses IBM’s Cost of a Data Breach 2025 figure for financial services, $5.56M; in healthcare the equivalent is $7.42M. Probabilities should come from your own incident history: if you have had two severity-one incidents in five years, your unrecoverable-outage probability is not 1%. Residual risk must be argued, not asserted, and is credible only if the component ends up supported, patchable, staffed by engineers who can debug it and covered by a tested failover.
The key-person row is the one boards most underestimate and most viscerally understand once named. A 22% annual probability that a named individual leaves is not pessimistic for someone in their late fifties who has been asked to defer retirement twice. That line does more work than any architecture diagram you will ever draw.
Argument 3: pricing the option value of speed
The hardest argument and the most valuable, because it is the only one connecting modernization to growth rather than defence. It is also where cases collapse into fantasy, because the temptation is to forecast revenue from products that do not exist. You are not forecasting. You are pricing an option.
Measure cost-to-change on a real change
Pick three or four changes the business actually requested in the last two years, ideally with an audit trail. Measure fully loaded cost and elapsed lead time for each, then estimate the same change in the target state.
| Representative change | Current elapsed | Current cost | Target elapsed | Target cost |
|---|---|---|---|---|
| Add a rating factor to the motor product | 14 weeks | £480k | 3 weeks | £90k |
| Launch a new cover variant (new SKU) | 9 months | £2.1m | 10 weeks | £550k |
| Add a mandated reporting field across the batch estate | 20 weeks | £620k | 4 weeks | £120k |
| Onboard a new broker via API | 16 weeks | £310k | 3 weeks | £70k |
The cost column belongs in the cost-avoidance model. The elapsed column is where option value lives.
Convert elapsed time to money the business owns
Do not compute the revenue impact yourself. Take the elapsed-time deltas to the business unit leader, ask them to price it, and attribute the number to them in the paper.
At Ardmore, the pricing lead stated in writing that on a £210m motor book, loss ratio drag was worth roughly £0.6m for every quarter a rating refresh sat undeployed. Three delayed quarters a year put the annual figure near £1.9m. That number went into the paper under the pricing lead’s name, not the CIO’s, which is the entire point. A speed benefit asserted by technology is a hope. The same benefit asserted by the P&L owner is a commitment.
You are not claiming the program generates £1.9m of new revenue. You are claiming it removes a constraint the business prices at £1.9m a year, and the business will decide separately whether to exercise the option. The Deloitte 2025 Tech Value Survey found around 60% of leaders believe another 21% to 50% of enterprise value remains trapped in current technology, data and people. Use that to explain why the option matters, not as a coefficient.
How to structure the ask so finance can say yes
A good model with a badly shaped ask still fails. A single four-year capital request is the worst possible shape, for reasons unrelated to the amount. It asks the committee to make one irreversible decision under maximum uncertainty, at the moment they know least about your delivery capability. Every governance instinct they have will say “come back next quarter.”
Stage-gated tranches with kill criteria you write yourself
- Tranche 0 (3 months, 3–5% of total): discovery, dependency mapping, and a costed migration plan for tranche 1. Gate: a plan the delivery partner and the internal team both sign.
- Tranche 1 (6–9 months, 15–20%): migrate one revenue-bearing but non-catastrophic component end to end, including decommissioning the original. Gate: the old component is switched off, not merely bypassed.
- Write your own kill criteria into the paper. If tranche 1 exceeds budget by more than 20% or its decommission date slips a quarter, the program pauses for re-approval. Volunteering the off-ramp is the most credibility-generating move available to you.
- Tranche 2 (12–18 months, 40–50%): the core, funded only after tranche 1’s gate is met and its actuals re-baseline the model.
- Tranche 3 (9–12 months, remainder): long tail, integration cleanup, final decommission wave.
- Re-forecast NPV at every gate using actuals, and present the revised number even when it is worse. A model that only ever improves is not a model.
- Set a hard sunset on dual-run per tranche, shown as a separate budget line that must reach zero.
The committee is not really approving £29m. They are approving £1.2m to find out whether you can be trusted with the rest. Say that out loud and you will usually get it.
Capex, opex and a conversation you should not have alone
Costs that can be capitalised and amortised hit the P&L differently from costs expensed as incurred, and in a year when EBITDA is under pressure that difference can decide the outcome. Treatment commonly turns on whether spend is development of internal-use software versus maintenance or reconfiguration, and on how hosting, subscription and cloud implementation costs are characterised. Rules differ between IFRS and US GAAP and depend on your contracts.
So this is the one section you do not write alone. Book time with your financial controller and external audit partner before the architecture is fixed, ask which elements are capitalisable and over what useful life, then let finance write it. Nothing here is accounting advice, and a case asserting a treatment finance has not confirmed will be corrected in the room, in public.
Fund decommissioning as its own committed line
The most reliable way to destroy a program’s returns is to build the new thing and never switch off the old one. It happens constantly, because decommissioning delivers no visible feature and is the easiest line to cut when the program is late.
Give it its own budget line, named owner and gate milestone, and where you can, tie part of program leadership incentives to decommission completion rather than go-live. Every pound of your cost-avoidance model depends on the old platform being switched off. If decommissioning is discretionary, your NPV is discretionary.
Attach the program to a date you did not choose
Modernization cannot manufacture urgency. It has to borrow it. Find the external, non-negotiable date already in your organisation’s calendar and attach the program to it: a DORA operational resilience deadline, PCI DSS 4.0 enforcement, a vendor end-of-support notice, an acquisition integration with a committed synergy timetable, a data centre lease expiry.
A program with an internal deadline gets deferred by internal decisions. A program tied to an external date has a cost of delay someone outside your organisation is enforcing, which changes the conversation from “should we” to “when do we start.”
What the board should see every quarter
Boards get the wrong metrics because engineering reports what it measures rather than what governs. Sprints completed and story points delivered tell a board nothing.
| Metric | Type | Why it belongs on the board pack |
|---|---|---|
| % of legacy estate decommissioned (by run cost, not component count) | Leading | The only proof that avoided cost is real |
| Dual-run cost this quarter vs. plan | Leading | Detects the failure mode that kills NPV |
| Change lead time on the representative change basket | Leading | Direct evidence for the option-value argument |
| Incident rate and severity: migrated vs. unmigrated components | Leading | Tests the risk-reduction claim empirically |
| Specialist contractor headcount and blended rate | Leading | Tracks the workforce risk you priced |
| Expected annual loss, re-scored | Lagging | Keeps the risk register alive rather than ceremonial |
| Run cost actual vs. do-nothing baseline | Lagging | Re-proves the counterfactual each quarter |
| NPV re-forecast at current actuals | Lagging | Honest, and no one else will do it |
Eight lines, one page. The first and fourth matter most, because they can falsify your case, and a metric that cannot falsify your case is decoration.
Five sentences that kill a business case, and what to say instead
“This will reduce technical debt.” Instead: “£4.1 million of last year’s £12.6 million run cost exists only because of the current implementation, and here is the ledger extract.”
“We need to modernize before we can innovate.” This is a request for permission to do work with no defined output. Instead: “A new product variant takes nine months and £2.1 million to launch. Our pricing director will tell you what that costs the motor book each year.”
“If we don’t do this, something bad will happen eventually.” Vague fear is discounted to zero. Instead: “There is a 22% annual probability we lose the last two people who can debug the rating engine, and recovery is estimated at £2.2 million. That line alone is worth £480,000 a year in expected loss.”
“The savings will fund the program.” Nobody believes this, and saying it costs you the benefit of the doubt on everything else. Instead: “This costs more than doing nothing for thirty-one months. Cash crossover is year four, discounted payback is year five, and I will show you the delay sensitivity.”
“We just need the budget approved and we’ll figure out the plan.” Instead: “I’m asking for £1.2 million and three months. If the resulting plan doesn’t hold up, we stop, and I’ll bring you that recommendation myself.”
The pattern: replace an unfalsifiable claim with a falsifiable one, and volunteer the downside before you are asked for it.
The politics: your allies, and the CFO’s real objection

You will not win this alone, and the people who can win it for you do not report to you.
The Chief Risk Officer is your most valuable ally and the most commonly ignored. Your risk register is their document in a different font. A CRO who co-signs the expected-loss table moves the paper from a technology request to an enterprise risk item, changing which committee sees it and how it is weighted.
The head of internal audit is second. If audit raised findings against the platform, or could not obtain control evidence because the system cannot produce it, those findings already sit in a register the board reviews, and an open governance item with no remediation plan gets funded.
The business unit whose roadmap is blocked is third: they own the revenue line and therefore the credibility to price option value. The financial controller is the quiet fourth, and will tell you how the ask should be shaped and which quarter it should land in long before the committee sees it.
Now the part most technology leaders get wrong. When a CFO pushes back on your number, the objection is almost never the number. It is delivery credibility. They are thinking about the last three programs: the one 60% over, the one that went live and never decommissioned its predecessor, the one that reported green for four quarters and then red. They cannot say “I don’t believe you can execute this,” so they say “the payback period is too long.”
Address the real objection. Bring the last three programs’ actuals versus plan, including the bad ones, and explain what is structurally different this time. Volunteer the kill criteria. Name the delivery leader and their track record. A CFO who believes the number but doubts the team will not fund you. A CFO who doubts the number but believes the team will fund the first tranche and let the number improve.
Frequently Asked Questions
What discount rate should I use in the NPV model?
The one your finance function already uses for internal capital projects. Ask FP&A directly rather than inferring it, and state it explicitly on the model page. If your organisation applies a risk premium to technology projects, use the premium rate and say you used it. Selecting a lower rate to improve the result is the most common self-inflicted wound in these papers: the first thing a reviewer checks is the rate, and a favourable one makes them distrust every other assumption in the model.
Should I include headcount reduction in the savings case?
Only if it is real, committed and owned by someone who can deliver it. Most modernization programs do not reduce headcount; they change what the same people work on, which is valuable but is not a cash saving. Contractor reduction is different, because contractors have end dates and rates you can point at. If you claim headcount benefit, name the roles and the date and get the owning executive to co-sign. An uncommitted saving is the fastest route to a credibility problem two years later.
What if the honest NPV is negative?
Then say so, and fund the program on the risk argument instead. Plenty of modernization programs have genuinely negative cost-avoidance NPV and are still obviously correct decisions, because expected-loss reduction or a regulatory obligation dominates. A negative cost line presented honestly alongside a strong risk case is more persuasive than a manufactured positive one. Boards fund things with negative direct returns constantly, including insurance. What they will not fund is a number they later discover was engineered.
How do I keep the case alive between approval and delivery?
Re-forecast at every gate using actuals, and publish the revised NPV even when it has deteriorated. Keep the risk register on the board pack and re-score it quarterly. Report percentage of estate decommissioned by run cost rather than component count. The purpose is not reporting hygiene; it is that programs of this length outlast the sponsors who approved them, and the case has to be re-winnable by whoever inherits it. A living model survives a change of CFO. An approval deck does not.
The Bottom Line
Modernization does not fail to get funded because executives are short-sighted. It fails because engineering leaders submit a technical argument to a financial process and are surprised when it does not convert.
The three arguments that convert are cost avoidance against a rising do-nothing baseline, reduction in risk-adjusted expected loss expressed the way your CFO already thinks about insurance, and the option value of speed priced by the business unit that owns the revenue. Build all three, keep them separate, and make sure any two carry the case alone. Then shape the ask so the first decision is small, the kill criteria are yours, and decommissioning is a committed line.
You are not asking for money to fix technology. You are asking to stop paying a compounding cost, to reduce a quantified expected loss, and to buy back the ability to change your own business. Written that way, it is one of the easier capital cases in the building.
If you are preparing this paper for a committee in the next two quarters, Modernize Software runs a two-week portfolio triage that produces the three artefacts your CFO will ask for: a run cost stack built from your own ledger, a quantified risk register your CRO can co-sign, and a tranche structure with kill criteria you would be comfortable volunteering. Bring your last failed business case to the first session; it is usually the fastest way to find what was missing.
.png)

 info@semanticdesigns.com
